#Builders

Sheet2Site

Create your own website without writing code using only Google Sheets.

Why use Sheet2Site ?

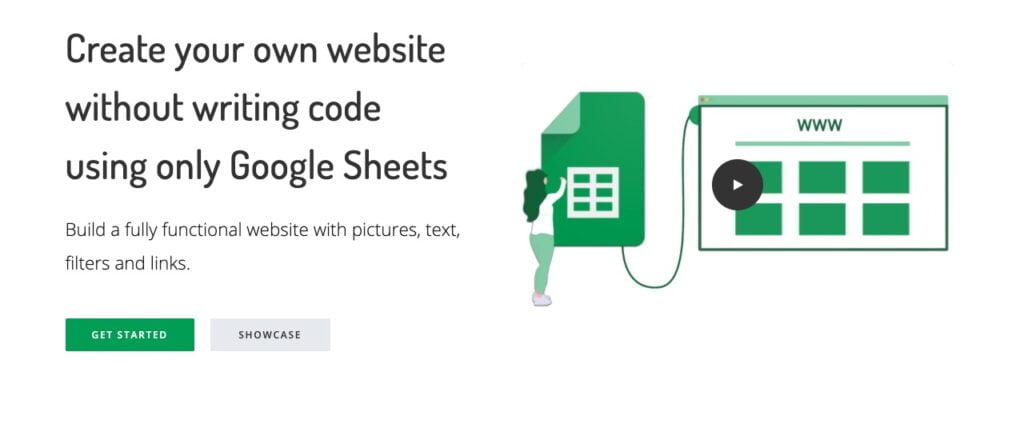
Sheet2Site is an online tool that allows you to quickly and easily create a website using a Google spreadsheet as a data source. This means that you can use cells from your spreadsheet as content for your site, without having to know web programming languages such as HTML, CSS and JavaScript.

One of the main advantages of Sheet2Site is its ease of use. Simply follow the steps in the site creation wizard to set up your spreadsheet and customize the look and feel of your site. You can also use predefined templates to speed up the creation process.

Once your site is online, you can easily update it by simply editing the data in your spreadsheet. This allows you to easily manage the content of your site without having to modify the HTML code or use a complex content manager.

In addition to site creation, Sheet2Site also offers advanced features such as online form creation, online payment setup, and dashboard creation from real-time data.

Sheet2Site is an ideal solution for small businesses, non-profits and individuals who want to create a website without having to learn web programming languages. It is also a convenient option for people who want to quickly set up a temporary or ephemeral website, such as for a special event or crowdfunding campaign.

In summary, Sheet2Site is a convenient and easy-to-use tool for creating websites using a Google spreadsheet as a data source. It offers a variety of advanced features to customize your site and make it unique, while providing a simple interface for managing and updating your content.

Key benefits of Sheet2Site

You can easily customize the look and design of your data visualizations.

Overview

Create your own website without writing code using only Google Sheets.

Discover Sheet2Site now

uiGradients is a collection of color gradients.
#Marketing and emails
Sparrow Charts is a graphical technique used to visualize and analyze your social media data. It is composed of a grid of dots or small icons called sparrows that represent the data values. The sparrows are arranged on a grid that consists of horizontal and vertical lines and is used to represent the different data values. The sparrows can be colored to reflect the relative value of the data to facilitate analysis and reporting. Sparrow Charts are very useful for continuously changing data, as they provide a quick and clear visual representation of the data.
#search engine
Andi is a search for the next generation using generative AI. Instead of just links, Andi gives you answers, like talking to a smart friend.
Avocode helps you share design files, quickly discuss changes and code, mobile applications and newsletters...
#startup tools
The ideas on this page are generated at 100 % by OpenAI's GPT-3, an artificially intelligent deep learning model with no human involvement, and trained by you and over 1,457,521 other people who liked or disliked the ideas
#Project management
Manage projects across all engineering, product, design and other teams.
#Inspiration
Handpicked design inspiration for your real-life projects
#art
AI art generator based on Stable Diffusion. Their website describes them as "an independent research laboratory exploring new mediums of thought and developing the imaginative powers of the human species."

In the same category