#search engine

Andi

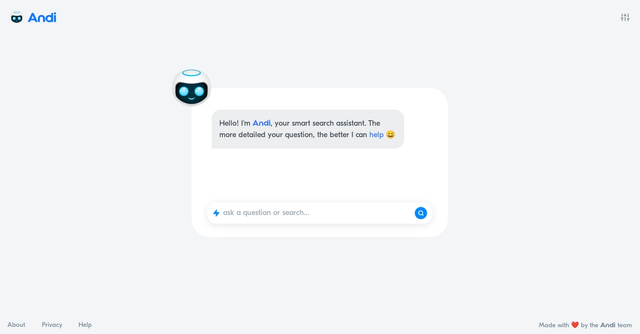
Andi is a search for the next generation using generative AI. Instead of just links, Andi gives you answers, like talking to a smart friend.

Why use Andi ?

Andi is a software platform that provides streamlined workflow management, collaboration and communication. With Andi, you can create and manage complex processes, connect to third-party applications, and securely share information. Andi enables organizations to create workflows for their business processes and manage them with metrics and dashboards. Users can create workflows and business processes using predefined templates or by building their own workflows. Templates can be customized to the users' needs and are easily modified and reused. Users can connect third-party applications to Andi and share information between them. Workflows can also be configured to send notifications and reminders to relevant users. Andi provides robust security and powerful analytics to enable users to monitor and manage their workflows and maintain a high quality of service.

Key benefits of Andi

Workflows can also be configured to send notifications and reminders to relevant users.

Overview
Andi

Discover Andi now

Writesonic is a powerful and fast tool designed to simplify online content creation, whether you're writing articles, chatbot scripts, optimizing SEO or creating other types of multilingual content.
Thanks to artificial intelligence, WP Generator is a content creation tool that allows you to generate automated content quickly and easily on wordpress, while saving time and money.
#Project management
Diagrams (formerly draw.io) is a free online flowcharting and diagramming application.
#Marketing and emails
Sparrow Charts is a graphical technique used to visualize and analyze your social media data. It is composed of a grid of dots or small icons called sparrows that represent the data values. The sparrows are arranged on a grid that consists of horizontal and vertical lines and is used to represent the different data values. The sparrows can be colored to reflect the relative value of the data to facilitate analysis and reporting. Sparrow Charts are very useful for continuously changing data, as they provide a quick and clear visual representation of the data.
#SQL
Data Explorer by OSS Insight is a GPT-powered query tool for GitHub live data exploration. Simply ask your question in natural language and Data Explore will generate SQL, query the data and visually present the results.
#assistant code
Replit has recently added a feature called Ghostwriter that uses AI to complete code. Write and run code in over 50 languages in your browser with Replit, a powerful IDE, compiler and interpreter.
#Colors
Search for any color by simply typing a keyword. Example: "Summer" to display summer colors. Retrieve the HEX code. Pin your favorite colors.
#Builders
Create your own website without writing code using only Google Sheets.
#3D
Game textures generated by AI. All these images were generated with a stable diffusion algorithm. Upload your generated texture to share it with the community!

In the same category