#low-code/no-code

Browse AI

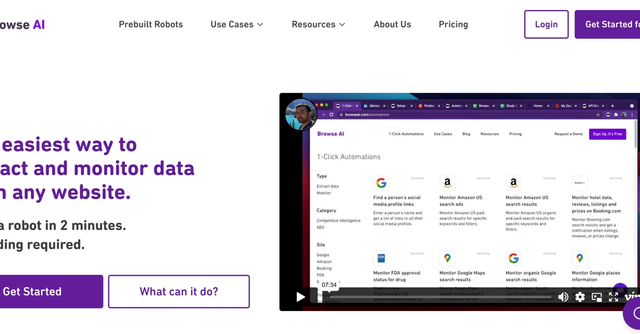
The easiest way to extract and monitor data from any website. Train a robot in 2 minutes. No coding required.

Why use Browse AI ?

Browse AI is a powerful tool that enables companies to create and manage automated workflows for their business operations. It provides a set of tools that enable organizations to create and manage data sources, machine learning algorithms and automated workflows. With Browse AI, companies can easily integrate their data, algorithms, and workflows to create end-to-end solutions tailored to their needs.

Browse AI provides organizations with a simple and flexible way to create custom data management solutions and algorithms. It makes it easy to create, deploy and manage workflows for organizations that need custom solutions and automated workflows. The tool can be easily integrated with database management systems, information management systems and customer relationship management (CRM) systems.

The key benefits of Browse AI are its flexibility, ease of use and power. Companies can create custom solutions that meet their needs and objectives. The tool can be used to create automated workflows and custom solutions for data processing, image processing and video processing. It also allows companies to track the progress of their workflows and solutions and react quickly to changes. Finally, Browse AI provides organizations with tools to control and monitor their workflows and data, as well as additional security to protect their data and workflows.
Key benefits of Browse AI

The tool can be easily integrated with database management systems, information management systems and customer relationship management (CRM) systems.

Overview

Browse AI

Discover Browse AI now

#Jobs
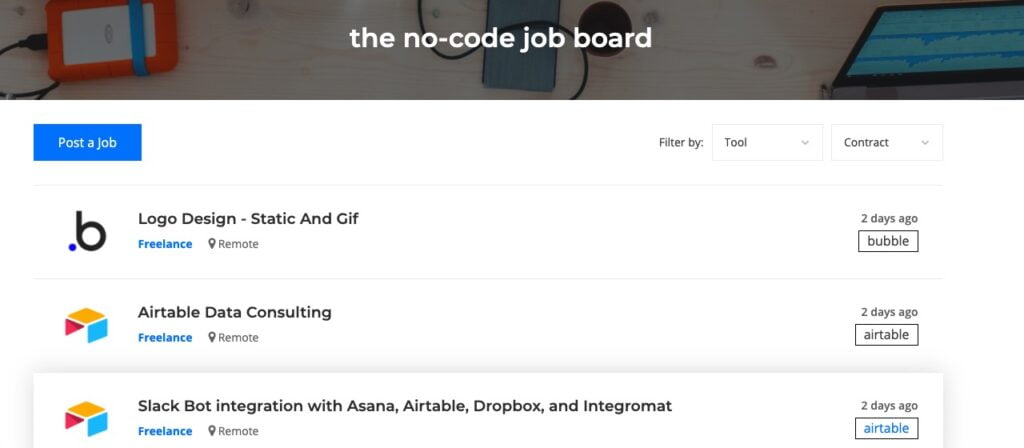
The work table without code
#Marketing and emails
Sparrow Charts is a graphical technique used to visualize and analyze your social media data. It is composed of a grid of dots or small icons called sparrows that represent the data values. The sparrows are arranged on a grid that consists of horizontal and vertical lines and is used to represent the different data values. The sparrows can be colored to reflect the relative value of the data to facilitate analysis and reporting. Sparrow Charts are very useful for continuously changing data, as they provide a quick and clear visual representation of the data.
#Emailing
Protonmail is the world's largest secure email service, developed by scientists at CERN and MIT.
#Analytics
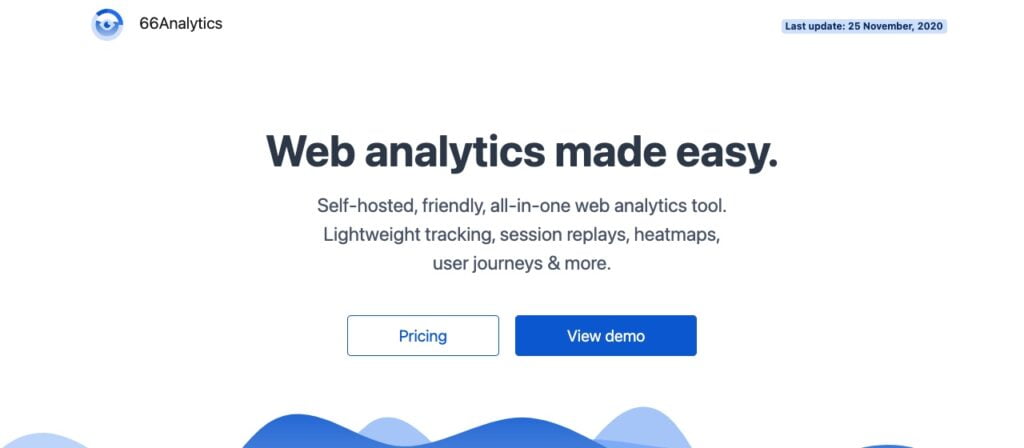
All-in-one self-hosting and web analytics tool.
#art
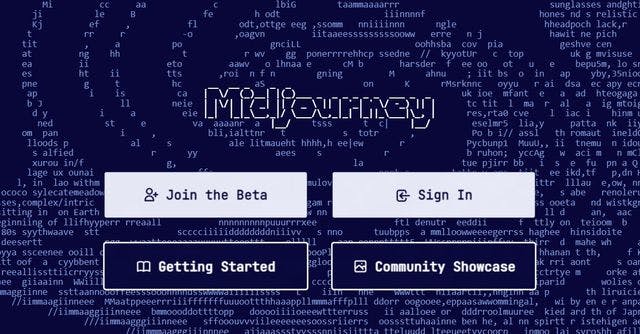
AI art generator based on Stable Diffusion. Their website describes them as "an independent research laboratory exploring new mediums of thought and developing the imaginative powers of the human species."
#Marketing and emails
A unique and powerful suite of software to manage your entire business.
#research
Get rid of your academic problems like science, math, literature, social studies and more with the help of Google AI and also get visual explanations of important concepts in each subject.
Cloudways is a cloud management platform that allows users to easily deploy, manage and monitor online applications across multiple leading cloud infrastructures, such as DigitalOcean, Amazon Web Services (AWS), Google Cloud Platform and Kyup.

In the same category