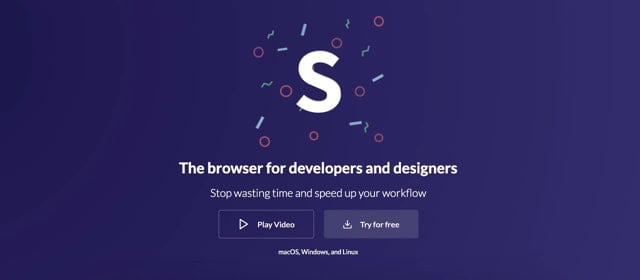
Sizzy is an online tool that allows developers and designers to test their website on different devices at the same time. It is especially useful for website development projects that target a mobile audience, as it allows you to see how the site displays and functions on different phones and tablets.
One of the main benefits of Sizzy is that it saves time by eliminating the need to switch between devices to test the site. By using Sizzy, you can instantly see how the site looks on multiple devices at the same time, allowing you to quickly detect problems and resolve them efficiently.
Sizzy is also very easy to use. Just type the URL of the site you want to test into Sizzy's search bar, and it will automatically display the site on a range of different devices. You can also customize the device selection to suit your needs, selecting the specific models you want to use for testing.
In addition to testing the site on different devices, Sizzy also offers a range of other useful features for developers and designers. For example, it makes it easy to compare the site on different devices, which is useful for spotting differences in display and function. It also offers a "night mode" feature that lets you see how the site displays in low-light conditions.
In summary, Sizzy is a convenient and easy-to-use tool for developers and designers who want to test their website on different devices. With its ability to display the site on multiple devices at the same time and its many useful features, it can help improve site quality and ensure an optimal user experience for all visitors.




 Français
  English