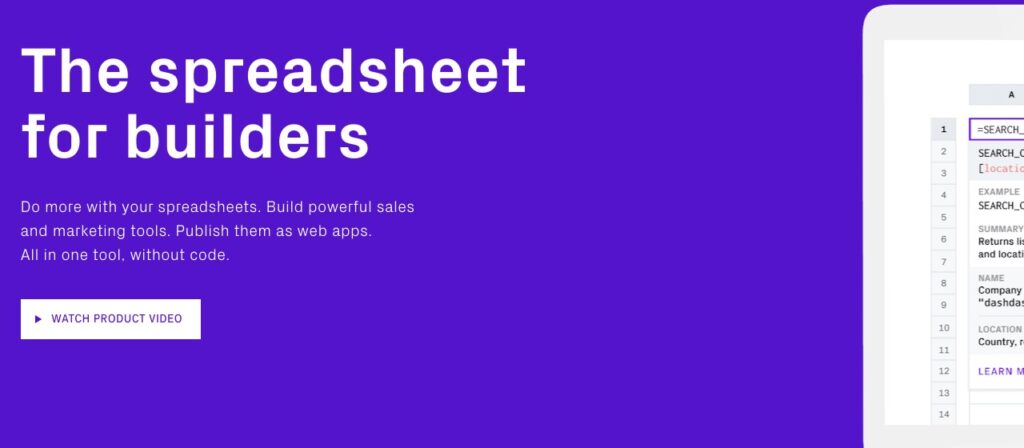
Dashdash software is an online platform that allows users to create and share dashboards, spreadsheets, and web applications without writing code.
Dashdash is especially useful for entrepreneurs, small and medium-sized businesses, and professionals looking to automate their work processes and better track their performance.
Key features of Dashdash include the ability to connect data from different sources, such as Google Sheets, Salesforce, and other popular online services. It is also possible to use formulas and functions to process this data and create charts and visualizations for a better understanding of the results.
In addition to its dashboard and spreadsheet creation tools, Dashdash also offers a web application development platform. With this platform, users can create online forms, websites and mobile applications without having to learn how to program.
Another advantage of Dashdash is its ease of use. The platform is intuitively designed and offers an easy-to-navigate interface, which makes learning fast and enjoyable. In addition, Dashdash offers a wide range of tutorials and online resources to help users get started and maximize their use of the platform.
In short, Dashdash is a versatile online software that allows users to easily create dashboards, spreadsheets, and web applications without having to write code. With its many features and ease of use, Dashdash is an ideal solution for entrepreneurs, small businesses and professionals looking to automate their work processes and improve productivity.