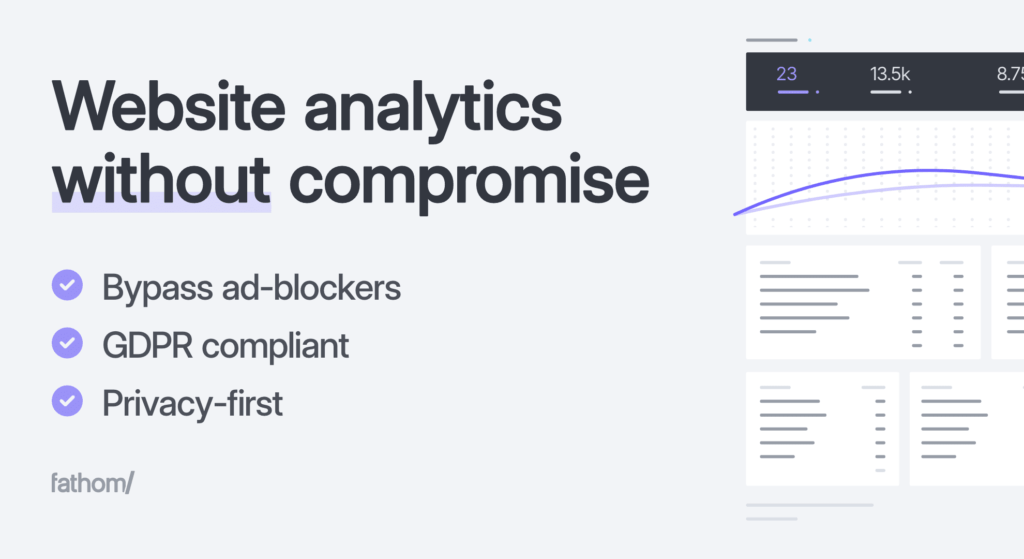
Fathom is a data visualization tool that allows you to create charts and tables quickly and easily. Designed to be used by users of all levels, Fathom is easy to use and allows you to create attractive and informative data visualizations in just minutes.
Fathom is especially useful for people who need to visualize data in a quick and easy way, without having to go through a complex charting process. This tool is especially useful for professionals who need to quickly create data presentations for their clients or team.
Among the main features of Fathom are:
A simple and intuitive user interface that allows you to create charts and tables in just a few clicks.
A wide range of chart and table types, including bars, pie charts, lines and scatterplots.
The ability to customize the colors and styles of your charts and tables to make them more attractive and easy to read.
Integration with other data visualization tools, such as Google Sheets and Excel, so you can easily work with your existing data.
Using Fathom, you can quickly transform your raw data into clear, easy-to-understand information. This tool is especially useful for people who need to quickly visualize data to make important decisions or to present information to an audience.
In summary, Fathom is an easy-to-use data visualization tool that allows you to create attractive charts and tables in just a few minutes. If you need to visualize your data in a quick and easy way, Fathom is a great solution.


