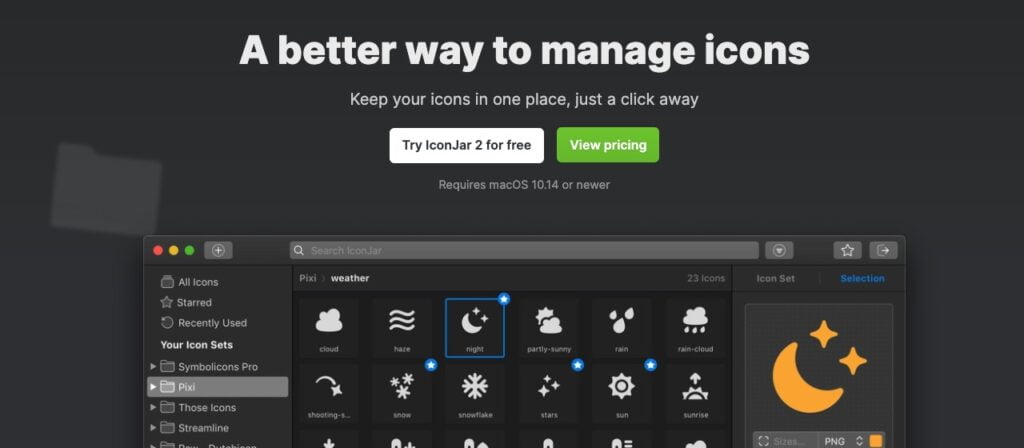
IconJar software is an icon file management tool for graphic designers and web developers. It allows you to store and organize all your icon files in one place, making them easy to find and use.
One of the main advantages of IconJar is its ease of use. Simply drag and drop icon files into the IconJar library, which automatically organizes them by folder and file name. You can also use tags and notes to add additional metadata to icons and sort them more finely.
IconJar supports many icon file formats, such as ICO, PNG, SVG and PDF, and allows you to export them to other formats or use them directly in your projects thanks to its integration functionality with software such as Sketch, Adobe XD and Photoshop.
In addition, IconJar has a live preview feature that lets you see how the icons will look before you use them in your work. You can also use the advanced search feature to quickly find the icon you're looking for, even in the largest libraries.
IconJar is also a great option for those who work in teams, as it offers real-time collaboration support and the ability to share icon libraries with other users.
In short, IconJar is an essential tool for web design and development professionals looking to efficiently manage their icon files. With its ease of use, support for multiple file formats, and preview and collaboration features, IconJar is a great choice for anyone looking to improve their content creation workflow.





 Français
  English