#research

PaperBrain

A platform for you to access and understand research papers. With paper summaries and direct pdf links, you'll never have to struggle with tedious downloads again. Built with a GPT wizard to help you along.

Why use PaperBrain ?

PaperBrain is a scientific research management tool that allows users to store, organize and share their scientific articles, as well as annotate and categorize them by subject. It also allows users to discover relevant new articles using recommendation algorithms based on the user's publications and interests. Benefits of using PaperBrain include:

Saves time: PaperBrain allows users to store all of their scientific articles in one place, making it easy to search and retrieve the necessary articles.

Organization: PaperBrain allows users to organize their articles by subject, annotate them and share them with other users, facilitating collaboration and communication between researchers.

Content discovery: PaperBrain uses recommendation algorithms to suggest relevant articles based on the user's publications and interests, allowing the user to discover new articles and stay current in their research area.

Remote access: PaperBrain is an online tool, which allows users to access their articles from anywhere, as long as they have an internet connection.

Key benefits of PaperBrain

Overview

PaperBrain

Discover PaperBrain now

#developer tools
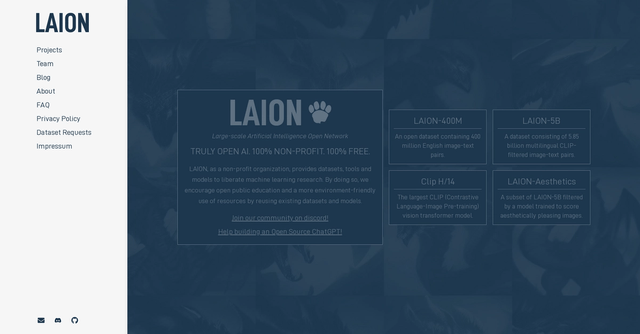
LAION, as a non-profit organization, provides datasets, tools, and models to unleash machine learning research. They promote open public education and more environmentally friendly use of resources by reusing existing datasets and models.
#Marketing and emails
Sparrow Charts is a graphical technique used to visualize and analyze your social media data. It is composed of a grid of dots or small icons called sparrows that represent the data values. The sparrows are arranged on a grid that consists of horizontal and vertical lines and is used to represent the different data values. The sparrows can be colored to reflect the relative value of the data to facilitate analysis and reporting. Sparrow Charts are very useful for continuously changing data, as they provide a quick and clear visual representation of the data.
#Motion design
The perfect package for all 3D artists who want to achieve breathtaking results quickly and without hassle.
#Builders
Create your own website without writing code using only Google Sheets.
#Notion
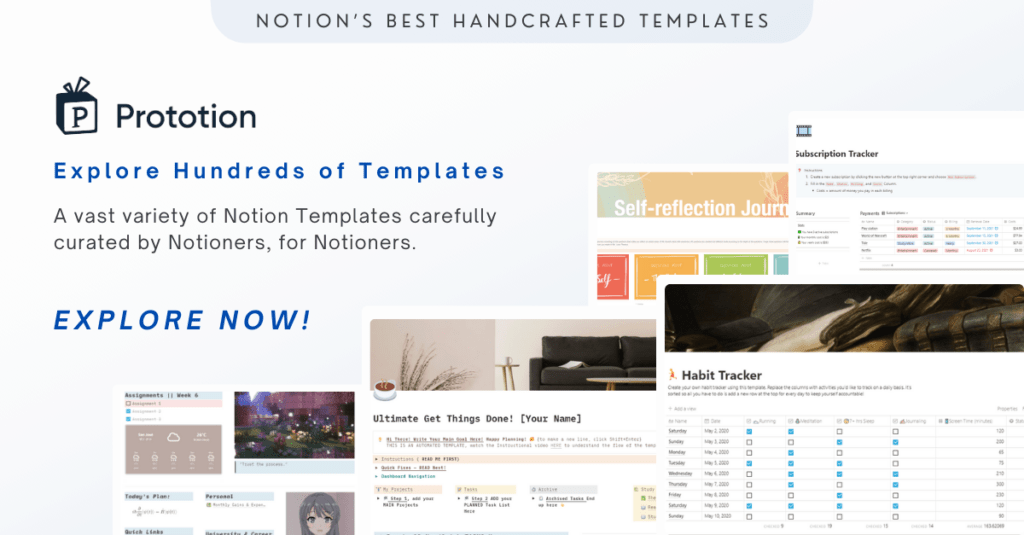
The best ready-made notion templates organized by the experts of prototion. Sign up for free today!
Uxcel is a user experience (UX) optimization and improvement tool. It allows companies and organizations to analyze their interfaces and websites to determine if they are easy to use and if they meet user criteria and expectations. Uxcel includes a set of tools and guides that help users understand and improve their user experience. These tools and guides cover the areas of research, design, visualization and analysis and provide valuable information for making data-driven decisions.

In the same category