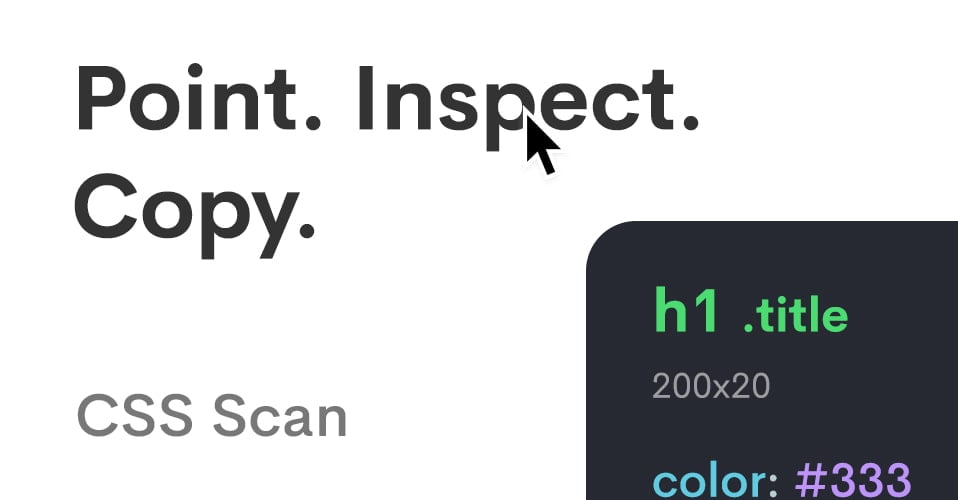
CSS Scan is an online tool that allows web developers to view and analyze CSS styles applied to any web page. It is a browser extension that can be installed on Google Chrome and Mozilla Firefox.
Once installed, the CSS Scan extension adds a new option to the browser context menu, called "CSS Scan". When you click on this option, a pop-up window appears, displaying all the styles applied to the selected element.
CSS Scan also allows you to see the values of each CSS property, as well as the source of the CSS file where the property is defined. This can be very useful when you are working on an existing website and need to know how a particular style was applied.
In addition to style analysis, CSS Scan also provides a search feature that finds all elements that have a specific style. For example, if you search for all elements with a red border, CSS Scan will show you all elements that have a red border, as well as the values of the border property.
CSS Scan is a very useful tool for web developers, as it allows them to quickly and easily see how CSS styles are applied to a web page. This can be especially useful when troubleshooting style issues or creating custom styles.
In summary, CSS Scan is a handy online tool for web developers that allows them to analyze and view the CSS styles applied to a web page, as well as search for elements that have a specific style. It is an essential tool for any web developer working on existing websites or creating new stylesheets.


