#SQL

AI Data Sidekick

Write SQL code, documentation and more 10x faster with our powerful recipe collection. Free for individuals and small teams.

Why use AI Data Sidekick ?

AI Data SideKick is an artificial intelligence-based automated data processing tool that helps users prepare, clean and enrich their data. It is designed to make users' jobs easier by automating tedious data cleaning and preparation tasks that can take hours or even days when done manually.

It can automatically detect and correct input errors, such as duplicates, missing values, and format errors, which can make data incomplete or inaccurate. It can also combine data from different sources, such as spreadsheets, databases and CSV files, to create a consolidated view of the data.

In addition, AI Data SideKick can add additional information such as geographic coordinates or reference data, which can help enrich the data and extract additional insights. It also allows for data visualization to facilitate analysis using interactive graphs and charts.

AI Data SideKick is for users looking to save time and improve the quality of their data for analysis or decision making. It is especially useful for companies that manage large amounts of data and are looking to automate data preparation tasks for use in analytics, machine learning or business intelligence projects.
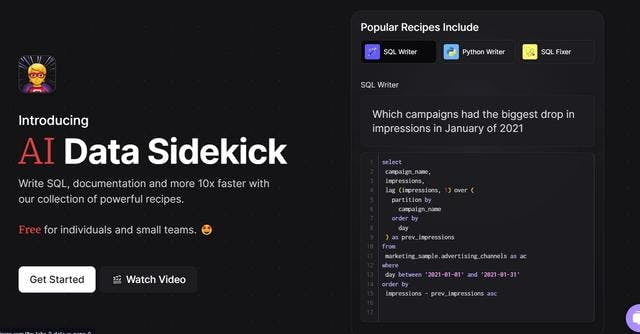
Key benefits of AI Data Sidekick

Overview

AI Data Sidekick

Discover AI Data Sidekick now

#Project management
Whimsical allows you to create mind maps, wireframes, diagrams or flowcharts in a simple and intuitive way.
#SEO
Detecting AI-written text in essays and emails. Their analysis is based on a combination of Open AI's existing Roberta base model for GPT detection and our own proprietary models.
#Marketing and emails
Sparrow Charts is a graphical technique used to visualize and analyze your social media data. It is composed of a grid of dots or small icons called sparrows that represent the data values. The sparrows are arranged on a grid that consists of horizontal and vertical lines and is used to represent the different data values. The sparrows can be colored to reflect the relative value of the data to facilitate analysis and reporting. Sparrow Charts are very useful for continuously changing data, as they provide a quick and clear visual representation of the data.
#Git
The world's leading software development platform
#developer tools
fast.ai is a non-profit research group focused on deep learning and artificial intelligence. They have several useful courses on their website.
#assistant code
Woebot is your personal mental health ally that helps you feel like yourself. Backed by clinical research, powered by AI.
#Project management
The intuitive and powerful project management platform loved by software teams of all sizes.

In the same category