#Chrome Extensions

CSS Scan

The fastest and easiest way to check, copy and modify CSS.

Why use CSS Scan ?

CSS Scan is an online tool that allows web developers to view and analyze CSS styles applied to any web page. It is a browser extension that can be installed on Google Chrome and Mozilla Firefox.

Once installed, the CSS Scan extension adds a new option to the browser context menu, called "CSS Scan". When you click on this option, a pop-up window appears, displaying all the styles applied to the selected element.

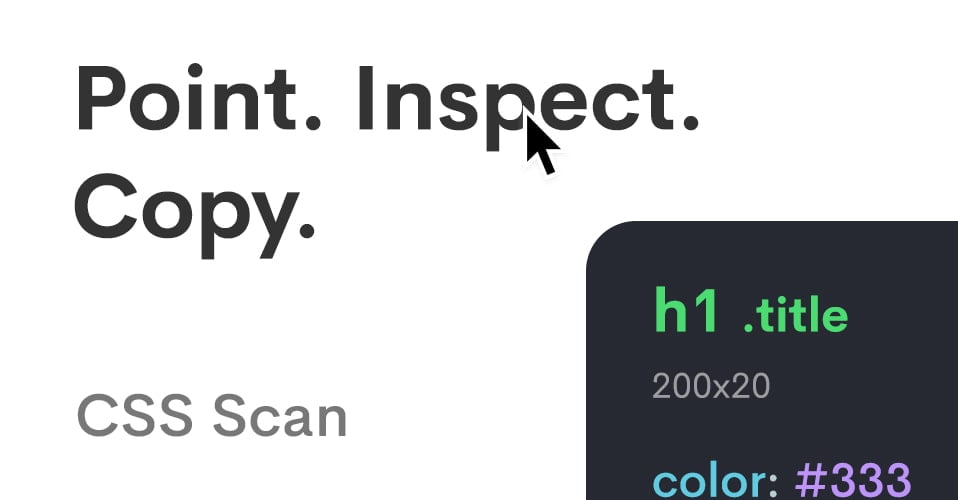
CSS Scan also allows you to see the values of each CSS property, as well as the source of the CSS file where the property is defined. This can be very useful when you are working on an existing website and need to know how a particular style was applied.

In addition to style analysis, CSS Scan also provides a search feature that finds all elements that have a specific style. For example, if you search for all elements with a red border, CSS Scan will show you all elements that have a red border, as well as the values of the border property.

CSS Scan is a very useful tool for web developers, as it allows them to quickly and easily see how CSS styles are applied to a web page. This can be especially useful when troubleshooting style issues or creating custom styles.

In summary, CSS Scan is a handy online tool for web developers that allows them to analyze and view the CSS styles applied to a web page, as well as search for elements that have a specific style. It is an essential tool for any web developer working on existing websites or creating new stylesheets.

Key benefits of CSS Scan

Overview

The fastest and easiest way to check

Discover CSS Scan now

#Vscode
A customizable extension to colorize correspondence materials.
#Marketing and emails
A framework that helps you quickly create HTML emails with Tailwind CSS and advanced post-processing.
#Analytics
Self-hosted web analytics, with privacy and simplicity at its core. Start your own SaaS business or use ...
#Marketing and emails
Sparrow Charts is a graphical technique used to visualize and analyze your social media data. It is composed of a grid of dots or small icons called sparrows that represent the data values. The sparrows are arranged on a grid that consists of horizontal and vertical lines and is used to represent the different data values. The sparrows can be colored to reflect the relative value of the data to facilitate analysis and reporting. Sparrow Charts are very useful for continuously changing data, as they provide a quick and clear visual representation of the data.
Discover Lucide AI, the essential tool for ensuring the authenticity and originality of your content in the digital age, while avoiding plagiarism and promoting 100% human content.
#Development
Launch your next SaaS in minutes with a modern SaaS gateway powered by Python.
#Notion
Noggin is the fastest and easiest concept course builder. Quickly turn your expertise into dynamic courses...
#Icons
Add colorful icons to your project with these Microsoft style icons.

In the same category