#finance

Sustainable

Get your business online in 30 seconds. The AI-powered platform for solo business owners. Generate a website, automate your marketing and manage your finances.

Why use Sustainable ?

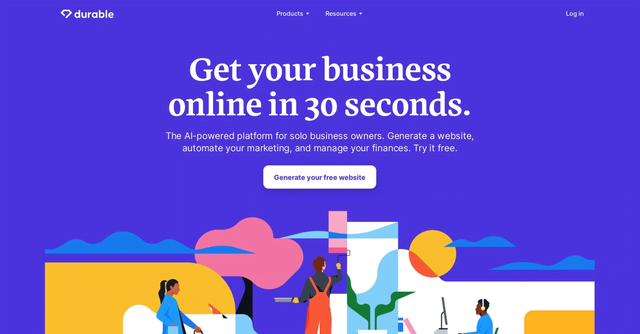
Durable is a workflow management software that allows companies to efficiently manage their business processes. It offers a variety of benefits for users, such as:

Automate repetitive tasks: Durable allows you to define rules and scenarios to automate common tasks, saving time and improving efficiency.

Real-time tracking: Durable provides a real-time view of the status of business processes, allowing users to track the progress of tasks and make decisions accordingly.

Real-time collaboration: Durable allows multiple users to work together on business processes at the same time, facilitating communication and coordination between teams.

Integration with other tools: Durable can be easily integrated with other tools such as content management systems, customer relationship management systems, etc.

Customization: Durable allows users to customize business processes to their specific needs, maximizing process efficiency.

Scalability: Sustainable is scalable and allows for the addition of users and business processes as the company grows.

In short, Durable is an effective tool to manage business processes, it allows to gain productivity and efficiency by automating repetitive tasks, by allowing real-time collaboration and by facilitating integration with other tools.

Key benefits of Sustainable

Real-time tracking: Durable provides a real-time view of the status of business processes, allowing users to track the progress of tasks and make decisions accordingly.

Overview

Sustainable

Discover Sustainable now

Uxcel is a user experience (UX) optimization and improvement tool. It allows companies and organizations to analyze their interfaces and websites to determine if they are easy to use and if they meet user criteria and expectations. Uxcel includes a set of tools and guides that help users understand and improve their user experience. These tools and guides cover the areas of research, design, visualization and analysis and provide valuable information for making data-driven decisions.
#Fonts
Detect font from an image
#Twitter
Supercharge your search on Twitter
#Notion
Noggin is the fastest and easiest concept course builder. Quickly turn your expertise into dynamic courses...
#Marketing and emails
Sparrow Charts is a graphical technique used to visualize and analyze your social media data. It is composed of a grid of dots or small icons called sparrows that represent the data values. The sparrows are arranged on a grid that consists of horizontal and vertical lines and is used to represent the different data values. The sparrows can be colored to reflect the relative value of the data to facilitate analysis and reporting. Sparrow Charts are very useful for continuously changing data, as they provide a quick and clear visual representation of the data.
#Git
A fast and user-friendly GIT client for Mac and Windows

In the same category