#Git

Github

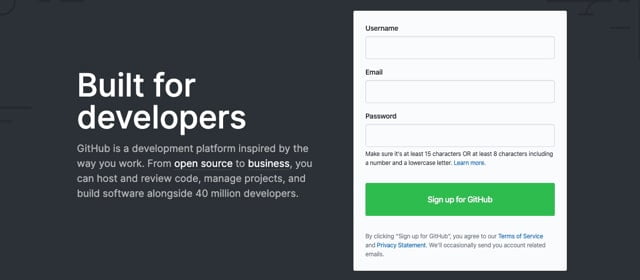
The world's leading software development platform

Why use Github ?

Github is a web service for hosting and managing software development, which was created in 2008. It is used by millions of developers and companies around the world.

Github is based on a versioning system called Git, which is an open source system. This means that the source code is freely available, and can be modified by anyone. This allows developers to work on the same project, without having to worry about version conflict issues.

Github provides developers with access to development and collaboration tools. Developers can create "repositories" or "repos" to store their code, and share it with other developers. Developers can also use tools such as testing platforms and continuous integration tools to verify and improve code.

Github is also very useful for collaborating with other people. Developers can invite other developers to contribute to their project, and give them "collaboration rights". This allows developers to work together on the same project, and help others solve problems and improve their code.

Github also offers tools to manage projects, such as "issues" or "tickets". Developers can assign tasks to specific people, and track the status of tasks. Developers can also discuss their code and project via pull requests or merge requests.

Key benefits of Github

Version management: Github allows developers to create and track versions of their code, making it easier to upgrade, test and maintain.

Overview

The world's leading software development platform

Discover Github now

#SEO
Moonbeam AI will give you everything you need to write long and effective content. Become 2x better at writing in 10 minutes.
#art
AI art generator based on Stable Diffusion. Their website describes them as "an independent research laboratory exploring new mediums of thought and developing the imaginative powers of the human species."
#Marketing and emails
Sparrow Charts is a graphical technique used to visualize and analyze your social media data. It is composed of a grid of dots or small icons called sparrows that represent the data values. The sparrows are arranged on a grid that consists of horizontal and vertical lines and is used to represent the different data values. The sparrows can be colored to reflect the relative value of the data to facilitate analysis and reporting. Sparrow Charts are very useful for continuously changing data, as they provide a quick and clear visual representation of the data.
#avatars
Create your perfect profile picture with AI. Your profile picture is the first thing people see when they view your profile. We use artificial intelligence to generate a picture of you that looks perfect and captures who you are. You can be anything, anywhere or anyone!
#Analytics
All-in-one self-hosting and web analytics tool.

In the same category