#copywriting

Jasper

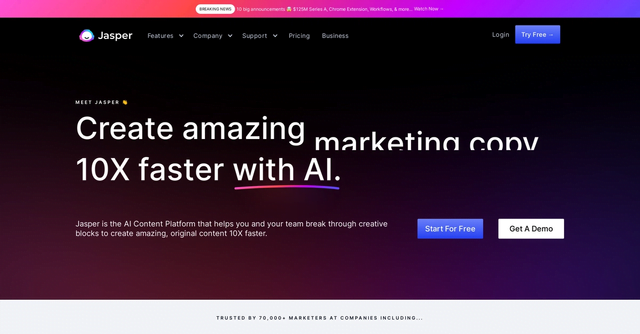
Create content 10 times faster with AI. Jasper is the writing tool

Why use Jasper ?

Jasper is a powerful analytics and reporting platform that helps companies make more informed decisions. It enables users to create and publish interactive reports and dashboards from internal and external data. Users can customize their reports and dashboards to meet their unique needs.

With Jasper, organizations can open up access to rich, organized, and up-to-date data on an integrated platform. It enables users to create reports and dashboards that provide a complete and up-to-date view of their data, giving them a better understanding of their business and performance.

Jasper has many benefits for users, including:

- Full data and reporting support, allowing users to manage their data and create reports and dashboards more easily.

- Advanced analytics and reporting capabilities that help companies make more informed decisions.

- An integrated platform that allows users to create reports and dashboards faster and with less effort.

- Visual authoring tools that make it easy to create reports and dashboards.

- Integration with tools such as Salesforce and Google Analytics, allowing users to leverage data from different sources.

- Enhanced security and ease of use, ensuring that data is stored securely and that users can access and use their data with confidence.

Key benefits of Jasper

An integrated platform that allows users to create reports and dashboards faster and with less effort.

Overview

Jasper

Discover Jasper now

#Emailing
Plans start at 3 $ per month. Free 30 day trial. All the control and features you love without scary survei...
#Jobs
The work table without code
CSS Gradient allows you to create gradients in CSS.
#Vscode
A customizable extension to colorize correspondence materials.
#Marketing and emails
Sparrow Charts is a graphical technique used to visualize and analyze your social media data. It is composed of a grid of dots or small icons called sparrows that represent the data values. The sparrows are arranged on a grid that consists of horizontal and vertical lines and is used to represent the different data values. The sparrows can be colored to reflect the relative value of the data to facilitate analysis and reporting. Sparrow Charts are very useful for continuously changing data, as they provide a quick and clear visual representation of the data.
#Chatbots
Itsalive provides a platform to easily create chatbots and services for brands.
#copywriting
Rytr is an AI writing assistant that helps you create high quality content, in just seconds, at a fraction of the cost!
Elevenlabs: Discover how to create natural voices using AI in any language. A perfect tool to integrate into your work, daily life or just for fun!
#Project management
Diagrams (formerly draw.io) is a free online flowcharting and diagramming application.

In the same category