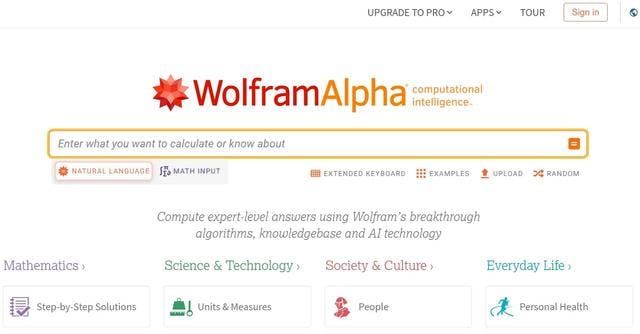
WolframAlpha is a powerful and feature-rich platform that enables users to solve complex scientific, mathematical and technological problems. It allows users to obtain information about data, methods, calculations and graphs, as well as information about scientific and technological areas. WolframAlpha is very useful for students looking for information, researchers looking for analytical data, and science professionals who want to get a comprehensive and detailed view of science and technology sectors. The benefits of using WolframAlpha are numerous. The platform is easy to use and provides detailed and accurate information on science and technology fields. In addition, it offers advanced tools for solving mathematical and scientific problems, as well as advanced search capabilities for accurate information. WolframAlpha also offers a variety of interactive graphics and visualizations to help better understand data and information. Finally, WolframAlpha is fully customizable and can be integrated with other IT tools and systems to facilitate tasks and workflows.
Why use WolframAlpha ?
Key benefits of WolframAlpha
- It offers advanced tools for solving mathematical and scientific problems, as well as advanced search capabilities for accurate information. WolframAlpha also offers a variety of interactive graphics and visualizations to help better understand data and information.
- It allows users to obtain information on data, methods, calculations and graphics, as well as information on scientific and technological sectors.
Overview







 Français
  English